
SPI Political Knowledge Lake | First wave across Taiwan’s six largest municipalities
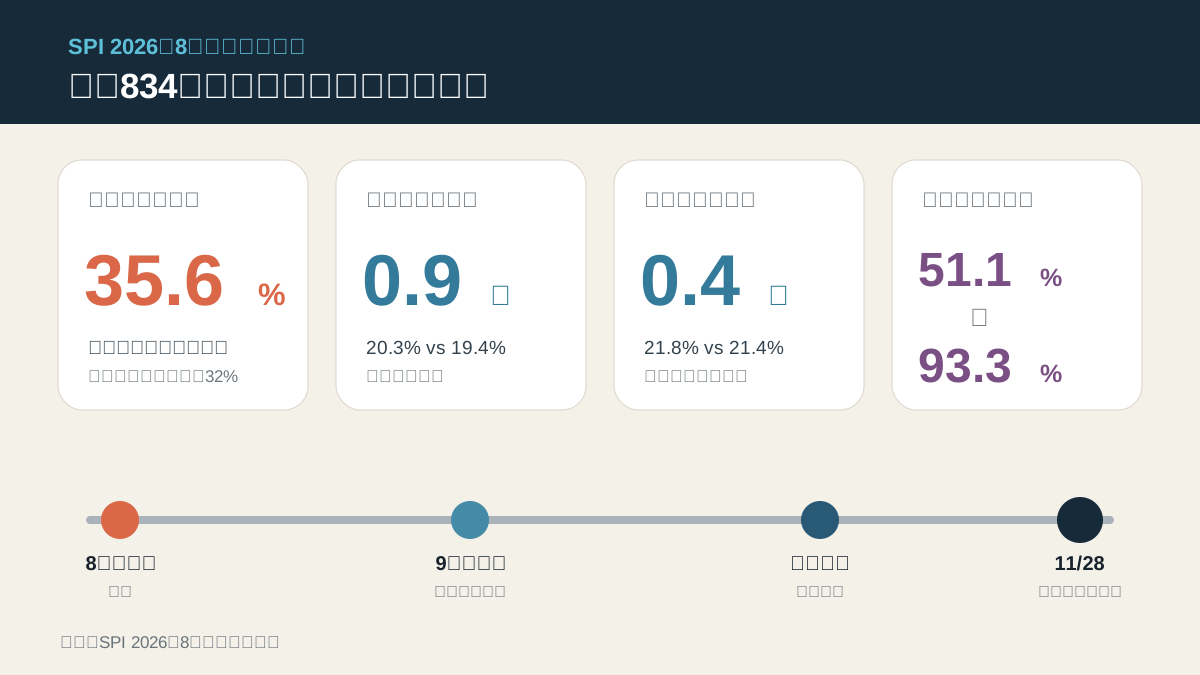
Figure note: The combined results use 834 eligible respondents. SPI first weighted each municipality to its voter profile, then combined the six using each municipality’s electorate. The result is not a simple average of six percentages. On this basis, 35.6% were undecided; the top-two gaps in New Taipei and Kaohsiung were 0.9 and 0.4 percentage points; and the share of each candidate’s supporters classified as firm ranged from 51.1% to 93.3%. The next wave will track how these figures move. Graphic by SPI.
Across the weighted six-city sample of 834 eligible respondents, 35.6% had not chosen a candidate and 10.7% explicitly selected “will not vote.” The top two were separated by only 0.9 percentage points in New Taipei and 0.4 points in Kaohsiung. Among the people already supporting a candidate, the share still needing to be consolidated ranged from 6.7% to 48.9%. Women were 41.7% undecided, while only 35.1% of respondents aged 20–39 rated themselves highly likely to vote. The strategic question is therefore not simply who leads today, but who can move undecided voters and turn expressed—but not yet locked-in—support into turnout.
By Tatt Chen, Founder and CEO, ShareParty Insight (SPI)
This was SPI’s first six-city wave, conducted from 31 July to 3 August 2026. After duplicate responses were removed, the survey contained 1,036 valid responses. The voting results in this article use only the 834 respondents eligible to vote in local elections in Taiwan’s six largest municipalities. This is not a forecast of November’s winners. It is an early read on which candidates have stable support and where votes may still move.
The implication is straightforward: the first-place name alone is an incomplete picture. Persuading undecided voters—and converting soft declared support into actual turnout—may matter more than an early ranking.
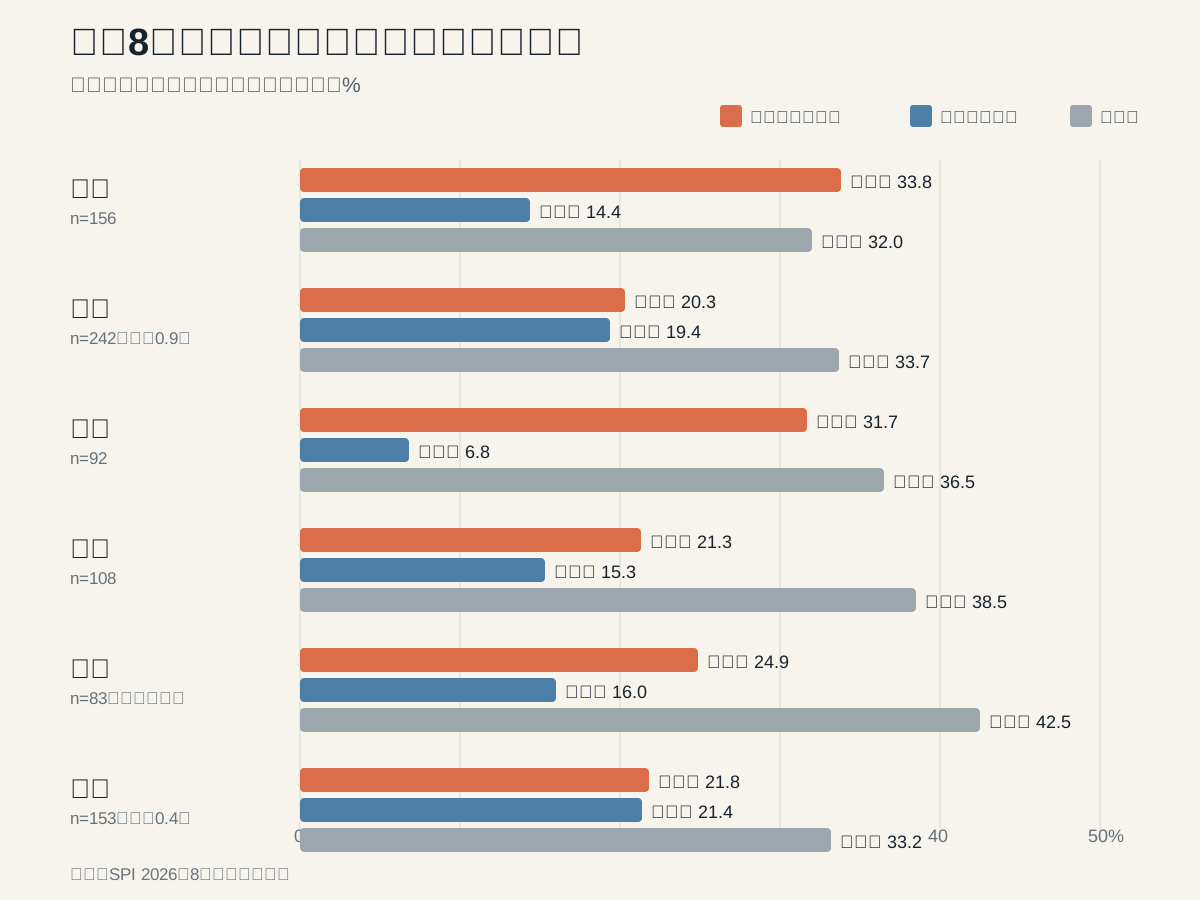
Figure 1: Each city percentage uses respondents from that city as its denominator. Candidate options reflect the questionnaire at the time of fieldwork. These are August early-support signals, not forecasts of November results.
| City (sample) | First choice now | Second choice now | Gap | Undecided | Explicit non-vote | High turnout likelihood | What to watch |
|---|---|---|---|---|---|---|---|
| Taipei (n=156) | Chiang Wan-an (蔣萬安) 33.8% | Puma Shen (沈伯洋) 14.4% | 19.4 pts | 32.0% | 11.7% | 47.0% | A clear lead, but almost one-third undecided |
| New Taipei (n=242) | Lee Shu-chuan (李四川) 20.3% | Su Chiao-hui (蘇巧慧) 19.4% | 0.9 pts | 33.7% | 13.0% | 44.2% | The top two are effectively tied; mobilisation also matters |
| Taoyuan (n=92) | Chang San-cheng (張善政) 31.7% | Huang Shih-chieh (黃世杰) 6.8% | 24.9 pts | 36.5% | 7.5% | 43.7% | A large lead, but considerable softness within the leader’s support |
| Taichung (n=108) | Ho Hsin-chun (何欣純) 21.3% | Johnny Chiang (江啟臣) 15.3% | 5.9 pts | 38.5% | 10.3% | 55.1% | A modest gap and almost four in ten undecided |
| Tainan (n=83) | Chen Ting-fei (陳亭妃) 24.9% | Hsieh Lung-chieh (謝龍介) 16.0% | 8.9 pts | 42.5% | 4.4% | 57.0% | The largest undecided share among the six |
| Kaohsiung (n=153) | Ko Chih-en (柯志恩) 21.8% | Lai Jui-lung (賴瑞隆) 21.4% | 0.4 pts | 33.2% | 13.4% | 55.0% | Effectively tied, with the highest explicit non-vote share |
Taipei and Taoyuan comprise the first condition: relatively large early gaps. New Taipei and Kaohsiung comprise the second: the top two are effectively tied. The third condition exists in every city: at least 32% were undecided, reaching 42.5% in Tainan. An August lead is therefore only a “lead signal,” not a November result.
The 0.9-point gap in New Taipei and 0.4-point gap in Kaohsiung should be read as “currently almost even,” not as evidence that either side has won. Taichung’s 5.9-point and Tainan’s 8.9-point gaps likewise remain early differences to track in the next wave.
“Explicit non-vote” means respondents who directly selected “will not vote.” It does not include everyone who rated turnout likelihood from 0 to 6. Kaohsiung (13.4%) and New Taipei (13.0%) were highest. In cities separated by 0.4 and 0.9 points, getting supporters to turn out may matter more than the current rank order.
SPI divided respondents who selected a candidate into two groups. “Firm” supporters rated both turnout likelihood and certainty of candidate choice at 7–10. “Soft” supporters rated at least one of these at 0–6. The latter group has insufficient turnout intention, insufficient certainty, or both; it does not mean every person in it will abstain.
The table ranks candidates by the share of current supporters who were both highly likely to vote and highly certain of their choice. “Needs consolidating” is the complement: people who named a candidate but rated turnout likelihood or candidate certainty at 0–6. They may not vote, may change choice, or both. The measure must not be interpreted as a definite non-vote rate.
| Rank | Candidate (city) | Current first choice | Firm share | Needs consolidating | Interpretation |
|---|---|---|---|---|---|
| 1 | Chen Ting-fei (Tainan) | 24.9% | 93.3% | 6.7% | Most consolidated current support; 42.5% of the city sample was still undecided |
| 2 | Ho Hsin-chun (Taichung) | 21.3% | 80.8% | 19.2% | A high firm share, while the citywide candidate gap remained modest |
| 3 | Lai Jui-lung (Kaohsiung) | 21.4% | 76.7% | 23.3% | A higher firm share, while total support trailed Ko by only 0.4 points |
| 4 | Su Chiao-hui (New Taipei) | 19.4% | 72.3% | 27.7% | A slightly higher firm share than Lee; total support differed by 0.9 points |
| 5 | Chiang Wan-an (Taipei) | 33.8% | 70.5% | 29.5% | Both an early lead and relatively consolidated support |
| 6 | Johnny Chiang (Taichung) | 15.3% | 70.3% | 29.7% | Lower current support, but a substantial firm share |
| 7 | Lee Shu-chuan (New Taipei) | 20.3% | 67.4% | 32.6% | A small gap from Su and somewhat more support needing consolidation |
| 8 | Huang Shih-chieh (Taoyuan) | 6.8% | 63.6% | 36.4% | Less current support and more than one-third still soft |
| 9 | Hsieh Lung-chieh (Tainan) | 16.0% | 61.6% | 38.4% | A markedly lower firm share than Chen |
| 10 | Ko Chih-en (Kaohsiung) | 21.8% | 60.5% | 39.5% | A marginal lead in total support, but more softness than Lai |
| 11 | Chang San-cheng (Taoyuan) | 31.7% | 51.6% | 48.4% | One of the largest leads, yet almost half of current support could move |
| 12 | Puma Shen (Taipei) | 14.4% | 51.1% | 48.9% | The largest share with low turnout likelihood or low candidate certainty |
The sharpest contrast is between Taoyuan and Tainan:
A lead is not necessarily secure, and trailing does not necessarily rule out convergence. Tracking only topline support in the next wave would miss much of the movement underneath.
This wave included only 41 respondents who had not been eligible to vote in 2022 and 43 Taiwan People’s Party voters. Even though both reached this article’s minimum disclosure threshold for subgroups, they are still too small to support a headline, a principal finding or a one-decimal-point flow estimate. SPI therefore does not publish party-flow percentages for either group in this release. We will reassess after later waves accumulate enough observations.
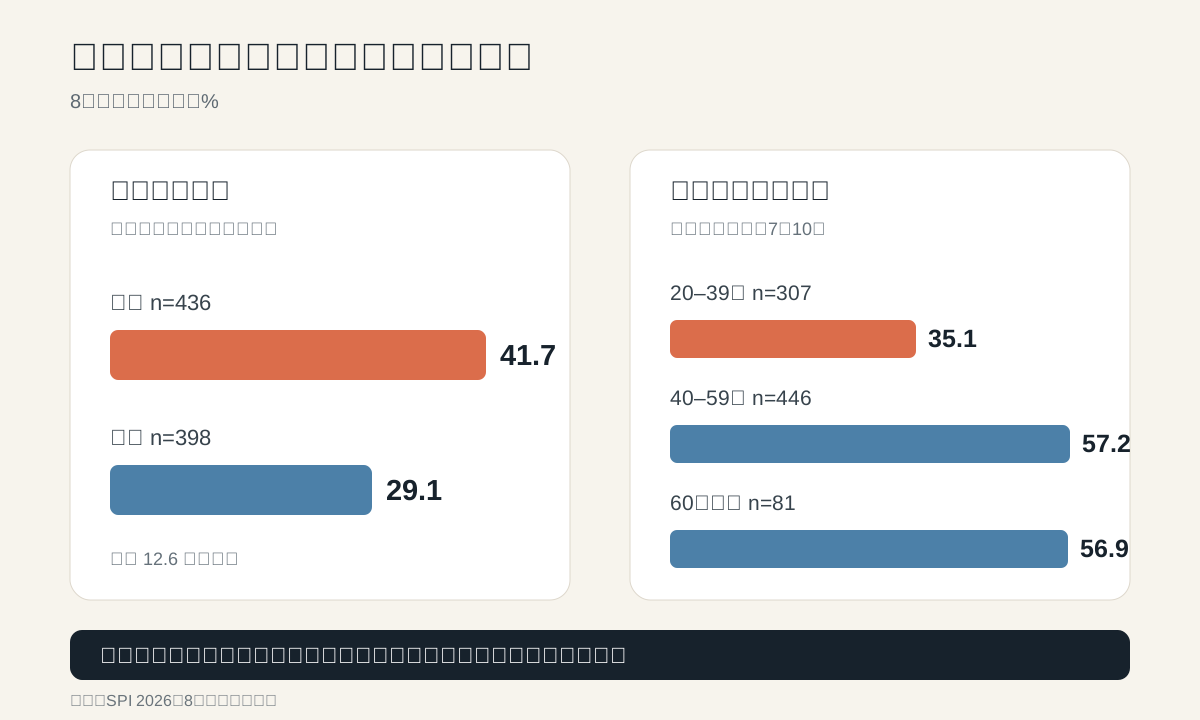
Figure 2: These are comparisons within the current sample; they do not represent the entire electorate.
Among women, 41.7% had not decided, compared with 29.1% of men. Women also more often selected “will not vote”—12.7% versus 8.5% among men. The question is therefore not only whom women support, but whether they have entered the contest at all.
The age gap is more direct. Only 35.1% of respondents aged 20–39 rated their turnout likelihood at 7–10, compared with 57.2% among those aged 40–59 and 56.9% among those aged 60 or older. Younger respondents were also 35.7% undecided and 14.1% explicit non-voters. For every party, the first question about younger voters may be whether they turn out—not which side they choose.
SPI Knowledge Lake retained all 834 eligible six-city voters in the candidate-choice analysis, then linked each anonymous Panelist ID to that person’s latest usable party-leaning response. People with no stated affiliation, a refusal or no historical answer remain separate groups; SPI does not infer a party for them.
| Prior party leaning | DPP candidate this wave | KMT candidate this wave | Undecided | Explicit non-vote | Turnout likelihood 7–10 |
|---|---|---|---|---|---|
| DPP (n=153) | 67.5% | 5.9% | 19.3% | 0.9% | 75.4% |
| KMT (n=110) | 9.2% | 66.8% | 13.5% | 4.0% | 61.0% |
| No party leaning (n=286) | 6.9% | 16.1% | 45.3% | 18.5% | 39.5% |
| No usable prior party response (n=214) | 3.4% | 8.3% | 52.3% | 14.2% | 36.5% |
The table shows only the two major-party candidates, undecided and explicit non-vote. Other candidates, minor-party candidates and refusals are omitted, so rows do not necessarily sum to 100%. Other minor-party samples are not yet large enough for stable interpretation and are not reported separately; SPI will publish them only after enough observations accumulate.
Roughly two-thirds of prior DPP and KMT identifiers currently chose their party’s candidate, indicating a real but not fully locked base. The larger opening was among people with no party leaning: 45.3% were undecided, 18.5% explicitly would not vote, and only 39.5% rated turnout likelihood at 7–10. The 43 Taiwan People’s Party voters are not used for a public flow conclusion in this table.
SPI plans one September follow-up: place the next wave beside this one and track changes in undecided voters, firm support, turnout intention and issue priorities across the six municipalities.
ShareParty Insight (SPI), founded and led by Tatt Chen, is a data-advisory company combining survey research with consented mobile-use behaviour. All data collection is consented and authorised. Analyses are released only as aggregate results; personal data are not published.
Tatt has more than 20 years of research, data and corporate experience. He previously served as Asia Senior Vice President at Penn, Schoen & Berland (PSB), a WPP research consultancy, leading its Hong Kong office and Asia business.
SPI Taiwan Political Intelligence
For a briefing on what these signals mean for your Taiwan decision, contact sales@sharepartyinsight.com.
This article was drafted with assistance from AI, but edited, verified and published by ShareParty Insight.
Research organisation: ShareParty Insight (SPI); lead: Tatt Chen
Field dates: 31 July–3 August 2026
Method: SPI’s Taiwan online research panel, recruited through major platforms including LINE, Google and Meta; mobile self-completion
Sample: 1,036 valid responses; six-city figures use 834 respondents eligible to vote in those local elections
Weighting: Weighted to 2022 Central Election Commission age and gender profiles within each municipality, then combined by municipal electorate size
Precision reference: approximately ±3.4 percentage points for the six-city sample; a reference for online-sample precision, not a probability-sample confidence interval
Responsible research organisation: ShareParty Insight (SPI). Lead: Tatt Chen. Field dates: 31 July–3 August 2026. Sampling: SPI’s Taiwan online research panel. Respondents were recruited through major internet platforms including LINE, Google and Meta and completed a mainly mobile questionnaire after consenting to research participation. Population proxy: 13,273,346—the combined 2022 electorate of the six municipalities published by Taiwan’s Central Election Commission—used as the weighting population. Sample: After duplicate responses were removed, the wave contained 1,036 valid responses; all voting figures in this article use only the 834 respondents eligible to vote in local elections in the six municipalities. 95% precision reference: Under a simple-random-sample formula, the reference margin is ±3.4 percentage points for the 834 six-city cases and ±3.0 points for all 1,036 responses. Because this is an online research panel, these are convenient indicators of sample precision, not formal probability-sampling confidence intervals. City and subgroup estimates have wider uncertainty. Funding: SPI-funded proprietary research. Party-history tracking: SPI Knowledge Lake used anonymous Panelist IDs to link six-city voters to the latest usable party-leaning response from prior monthly surveys. Cases without a usable answer remained “no usable prior party response”; none were inferred or imputed. All 834 people remain in current candidate results. Only group statistics are published; individual political data are not exported. Weighting: Each municipality was adjusted to the age and gender structure of its 2022 electorate, with each respondent’s adjustment limited to 0.25–4.0 times, then the six were combined by electorate size. These are interim weights based on 2022 voter structure—not a 2026 final electoral roll and not an internet-population weight. Turnout: Self-rated turnout likelihood is reported separately and is not used to adjust candidate support. Other disclosures and limitations: City and subgroup samples are smaller and differences should be treated as early tracking signals. SPI considers subgroup publication only at n≥30; headline or principal-finding use also requires a separate assessment of size and stability. Candidate options reflect the questionnaire at fieldwork and are not an official registration list. These are August tracking results, not probabilities of winning in November.