
In Taipei, Puma Shen has narrowed the gap with Chiang Wan-an. In Kaohsiung, Ko Chih-en’s support has risen, bringing her close to Lai Jui-lung. ShareParty Insight’s third survey wave follows the same respondents and finds two different patterns: the number of undecided respondents has fallen more in Taipei, while nearly three in ten in Kaohsiung still have not decided.
This wave also adds recorded video, app and website activity. The findings are a reminder that candidate-related content reaching more accounts does not necessarily mean more support. Nor does a platform attracting more discussion mean audiences have moved there in large numbers. Changes in choice and the content people encounter need to be examined separately.
Our August article, “Taiwan political messaging test: prioritising 12 policy messages”, compared how policy proposals were received. The early-September article, “Voters did not fall back in line”, found many voters still waiting to decide. This update follows the same people’s choices over time and adds records from their linked video accounts, apps and news websites, extending the view from whom they chose to what they encountered.
The same respondents: how did their choices change?
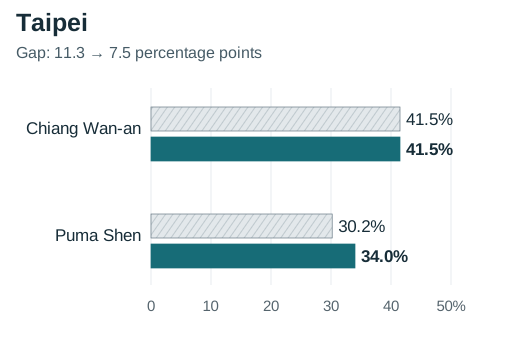
Taipei: Shen closes the gap, but undecided respondents did not move in just one direction
Among the same Taipei respondents, Chiang remained at 41.5%, while Shen rose from 30.2% to 34.0%. Their gap narrowed from 11.3 to 7.5 percentage points; the undecided share fell from 20.8% to 15.1%. These are changes among the same respondents, not estimates of citywide support.
Equal numbers of previously undecided respondents chose Chiang and Shen this time. The narrower gap therefore does not mean Shen captured all the undecided support. Shen also gained respondents who had previously supported Chiang, while some of Chiang’s former supporters became undecided.
Shen did not only gain support: some respondents who chose him in the previous wave selected Kuo Hsi, a newly added questionnaire option, this time. Because Kuo was absent from the earlier candidate list, that change cannot simply be counted as a confirmed vote switch. The next question for Taipei is whether those who made a choice this wave will make the same choice again.
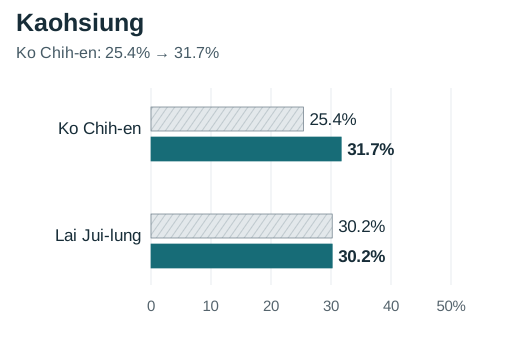
Kaohsiung: Ko rises, Lai holds steady, and nearly three in ten remain undecided
Among the same Kaohsiung respondents, Ko rose from 25.4% to 31.7%, while Lai remained at 30.2%. Lai led by 4.8 percentage points in the previous wave; Ko led by 1.6 points this time. The order changed within this sample, but the small gap is not enough to establish a citywide reversal.
Ko’s new support came from previously undecided respondents and people who had selected Lai or Chang Ching. Lai gained support from Chang and from undecided respondents, while others moved to Ko, newly added questionnaire option Hung Fang-lung, or undecided. His overall share stayed the same.
The biggest difference from Taipei is that Kaohsiung’s undecided share fell only from 30.2% to 28.6%, a decrease of 1.6 percentage points, compared with Taipei’s 5.7-point fall. A larger proportion of this Kaohsiung sample remains undecided. The small gap between the two leading candidates should not be mistaken for a settled race.
Video tracking: beyond the platform, which videos were encountered?
In addition to asking whom respondents support, SPI tracks YouTube and Shorts records from their linked video accounts, with their consent. Video titles let us identify specific content—an interview, a speech or a news report—and compare what the same accounts encountered during the week before each survey response. This comparison includes accounts from across the six cities with records in both periods.
Based on video titles, more accounts had records of Shen-related videos in the latest period, and more had Chiang-related records. In other words, videos related to both candidates appeared in more accounts’ records. The numbers of accounts are small, so individual percentages are not reported here.
Which videos reached more of these accounts? Among videos related to these two candidates in the latest period, Shen’s interview on BCC’s “欸!我說到哪裡了?” appeared in the most accounts. Next was Mirror News’ video labelled “uncut”, showing Shen’s speech to his supporters’ association in Japan; its title also mentioned Chiang. Records for each individual video were few, so this article does not report their percentages.
These records identify the specific content audiences encountered, taking the analysis beyond whether they used YouTube at all. But accounts may be shared, exposure does not mean agreement, and changes in support cannot be attributed to any single video.
Beyond YouTube: LINE and Facebook have the widest use; Threads is around three in ten
We separately compared Android participants with app records on at least three days in each period. This group differs from the video-account group above, so the percentages are not interchangeable. In the latest period, 83.0% had recorded LINE openings, 76.3% Facebook, 68.9% YouTube and 28.9% Threads. The corresponding figure for Instagram was 43.7%. In the same order, the previous-period figures were 81.5%, 77.8%, 68.9%, 30.4% and 45.2%. Changes were small. Fewer people had TikTok and X records, so their percentages are not reported here.
For the news domains examined, the share with recorded visits was also similar: 56.3% previously and 54.8% this time. These records do not show a major shift between platforms. LINE and Facebook retained broad use, Threads was around three in ten, and more than half still had recorded news-site visits. These are app-opening and website-visit records, not measures of political-content readership.
Political ads: no observed expansion in reach; rising support cannot be credited directly to advertising
The same people with Android social-ad records in both weeks generated more than 36,000 ad records in each week. Only a very small number had recorded exposure to ads bearing candidate or party names in either week. Identifiable political-ad contacts remain scattered, with no signal of broader reach; the small difference between the weeks is also insufficient to establish a decline.
This continues the observation in our 1 September article, “Undecided voters are the largest single group: what digital behaviour suggests testing next”. Political ads have appeared; whether their reach expands is the change to track next. The earlier article inventoried advertisers over 66 days. This update holds the people constant and compares two consecutive September weeks; it does not subtract one article’s figures from the other’s.
Everyday policy differences need to show up in the monthly household bill
Our previous two articles examined policy messages and everyday pressures. This wave made the proposals more concrete. The shares saying they would be more willing to consider a candidate offering each proposal were:
Lower out-of-pocket childcare and long-term-care costs, making monthly household spending more predictable: 53.1%.
Expand rental and first-home subsidies, and publish progress on affordable housing in each district: 46.4%.
Provide fixed electricity and public-transport reductions for lower- and middle-income households: 41.5%.
These are stated responses to hypothetical proposals among political-question respondents across Taiwan, not only the six cities. They do not explain the support changes above and cannot be compared directly with August’s differently worded questions.
The next messaging study should ask more practical questions. Do respondents understand the amounts and eligibility? Do they understand funding, implementation and timing? Where do misunderstandings arise? Neutral research on message comprehension and proposal evaluation can establish what lies behind saying “I support this proposal”. This wave’s figures do not guarantee votes for any proposal.
The other three cities: a brief look at different directions
In New Taipei, the gap between Lee Ssu-chuan and Su Chiao-hui narrowed from 5.1 to 2.5 percentage points. In Taichung, support for Johnny Chiang and Ho Hsin-chun rose together, leaving their gap at 7.0 points. In Tainan, the gap between Chen Ting-fei and Hsieh Lung-chieh widened from 15.6 to 18.8 points. Taoyuan’s matched sample is too small, so its results are not reported in this article.
Fewer respondents are undecided, but this is not the final result
Among the same respondents across the six cities, the undecided share fell from 31.8% to 29.1%, a decrease of 2.7 percentage points. Overall, 19.5% changed their answer. Changes included switching candidates, making a choice after being undecided, returning to undecided, or selecting not voting or prefer not to answer.
The next wave should focus on three questions rather than another verdict on the rankings: do undecided respondents continue making choices; does support concentrate further around the two leading candidates; and do those who have chosen maintain that choice and say they will vote?
Taipei’s larger fall in undecided respondents and Kaohsiung’s remaining undecided share of nearly three in ten are this wave’s clearest contrast. The next test is whether these new choices last. One answer is not a final result. Following the same people lets us see how those choices develop.
Methodology
Conducted by ShareParty Insight; study lead: Tatt Chen (陳彥廷), CEO; funded from ShareParty Insight’s own resources.
Fieldwork and population: this is an interim snapshot covering 16 September to 22 September 2026 at 06:45 Taipei time. The previous wave ran from 31 August to 8 September. Respondents aged 20 or over completed an online questionnaire through the ShareParty online panel and passed an attention check; political questions required separate consent. This is a non-probability sample and results are unweighted. The population reference is the Ministry of the Interior’s “August 2026 household registration statistics analysis”: 19,640,702 registered residents aged 20 or over. This is a household-registration statistic, not the panel’s sampling list.
Sample: 1,111 unique respondents in the current wave; 407 answered the six-city mayoral item, and 292 could be compared with their own previous answers. Matched city samples were Taipei 53, New Taipei 79, Taoyuan 22, Taichung 43, Tainan 32 and Kaohsiung 63. Candidate-support percentages use each city’s matched group as the denominator. Valid samples for the three policy questions, in the order presented, were 618, 617 and 610.
Mobile behavioural data: video findings use 99 linked accounts with records in both periods, approximately one-third of the 292 matched respondents. App and news-site findings use 135 Android participants with app records on at least three days in each period, approximately seven in ten of the 184 self-reported Android respondents. News coverage uses 15 prespecified domain families; all percentages use the same 135 people as the denominator, of whom 122 had website records in both periods. Both comparisons use the 168 hours before each survey response and are unweighted. The groups cannot be added together and do not represent all matched respondents or all voters. Accounts may be shared and records may be incomplete. A name appearing in a title does not establish support or actual influence.
Ad tracking: the existing ShareParty panel group contained 682 people, including all 292 matched survey respondents in this article; it was not separately recruited. Android social-ad records were available for 201 people during 7–13 September and 198 during 14–20 September. The ad percentages use the same 185 people with records in both weeks; 85 of them also belonged to the 292-person survey comparison. Both weeks used the same identification rules. Advertisers were matched by exact name; account ownership, the actual payer and content stance were not independently verified. All matching records were on Facebook. Records in both weeks do not establish continuous capture. Most X records lack advertiser names; coverage excludes iOS, LINE, offline activity and YouTube ads whose advertisers cannot be identified. The 1 September article was a 66-day advertiser inventory, not this fixed-person weekly exposure rate, and the two cannot be subtracted directly. No observed record does not mean no advertising. These data cannot estimate total market ad volume, spending or voting effects.
Uncertainty: a non-probability sample has no directly applicable population margin of random sampling error. For reference only, a simple-random-sample formula at 95% gives approximately ±4.9 percentage points for 407 respondents and ±5.7 for 292. These are not this study’s actual errors or city-level errors. The paired descriptive 95% interval for the change in undecided share is −6.8 to +1.4 percentage points and includes no change.
Comparison limits: Kuo Hsi in Taipei and Hung Fang-lung in Kaohsiung were absent from the previous candidate list; changes involving newly added options are not automatically counted as vote switches. Some answers on support certainty, council-party preference, turnout likelihood, information channels and topic exposure are missing and were not used to judge the race. The earlier August-to-September comparison of 404 people is a different matched group and is not joined directly to this 292-person comparison. For the full questions, methods and tables, contact sales@sharepartyinsight.com.